


How Much Is Engineering Drift Costing You? Meet the Engineering Drift Calculator
Every line in your engineering budget, from headcount to licences, has a number and is tracked, forecast, and reviewed. Engineering drift isn’t, but its cost runs through all of them.
We kept hearing the same thing from engineering leaders. At our CTO session during SF Tech Week, attendees reported velocity gains of 3x or more from AI coding tools, yet review load and rework grew alongside them. Almost no one could say what that rework was costing.
That was why we've just released the Engineering Drift Calculator, a free tool that lets engineering leaders calculate their own drift, challenge their assumptions, and bring a concrete figure to the next budget meeting.
In San Francisco, when one of our attendees ran the numbers with us, their first reaction wasn’t to the total but to their own rework share. It turned a two-minute exercise into a longer conversation about how their team actually measures rework.
Key Takeaways
- Engineering drift has a real cost, but it hides inside headcount, cloud, and licence lines.
- We released the Engineering Drift Calculator so engineering leaders can size that cost themselves, with their own numbers, in about two minutes.
- It returns two numbers: your estimated annual cost of drift and the share of that cost you could recover.
- The result is a starting point for investigation and a budget conversation, not a promise that every lost hour can be won back.
Why the Cost of Engineering Drift Doesn’t Show Up in Your Budget
Engineering drift is the gradual gap between how your organization intends to build software and what actually ships: the wrong library, an ignored convention, a component rebuilt from scratch. Unlike technical debt, which is a shortcut a team chooses and tracks, drift is something nobody decides. Left unaddressed, it hardens into technical debt, which the Consortium for Information & Software Quality estimated at around $1.52 trillion in the US in 2022.
Costs get managed when someone owns them, and drift has no owner. It sits inside lines you already pay for: rework after review, senior engineers correcting patterns instead of designing systems, and time spent reconciling AI output with the design system and architecture it should have followed. Engineering sees friction where finance sees headcount. Neither sees a cost it can reduce, so it is absorbed into your software development costs.
AI coding tools have made engineering teams faster. DORA’s 2025 research, based on nearly 5,000 technology professionals, found that 90% now use AI at work, and that AI adoption still has a negative relationship with delivery stability even as output rises. GitClear’s analysis of 211 million changed lines, reported by LeadDev, found an 8x increase in duplicated code blocks during 2024.
The pattern is consistent: AI-assisted software development increases output, not alignment. More code, written faster, against standards the model never saw, means drift compounds faster.
What Drift Costs: An Illustrative Example
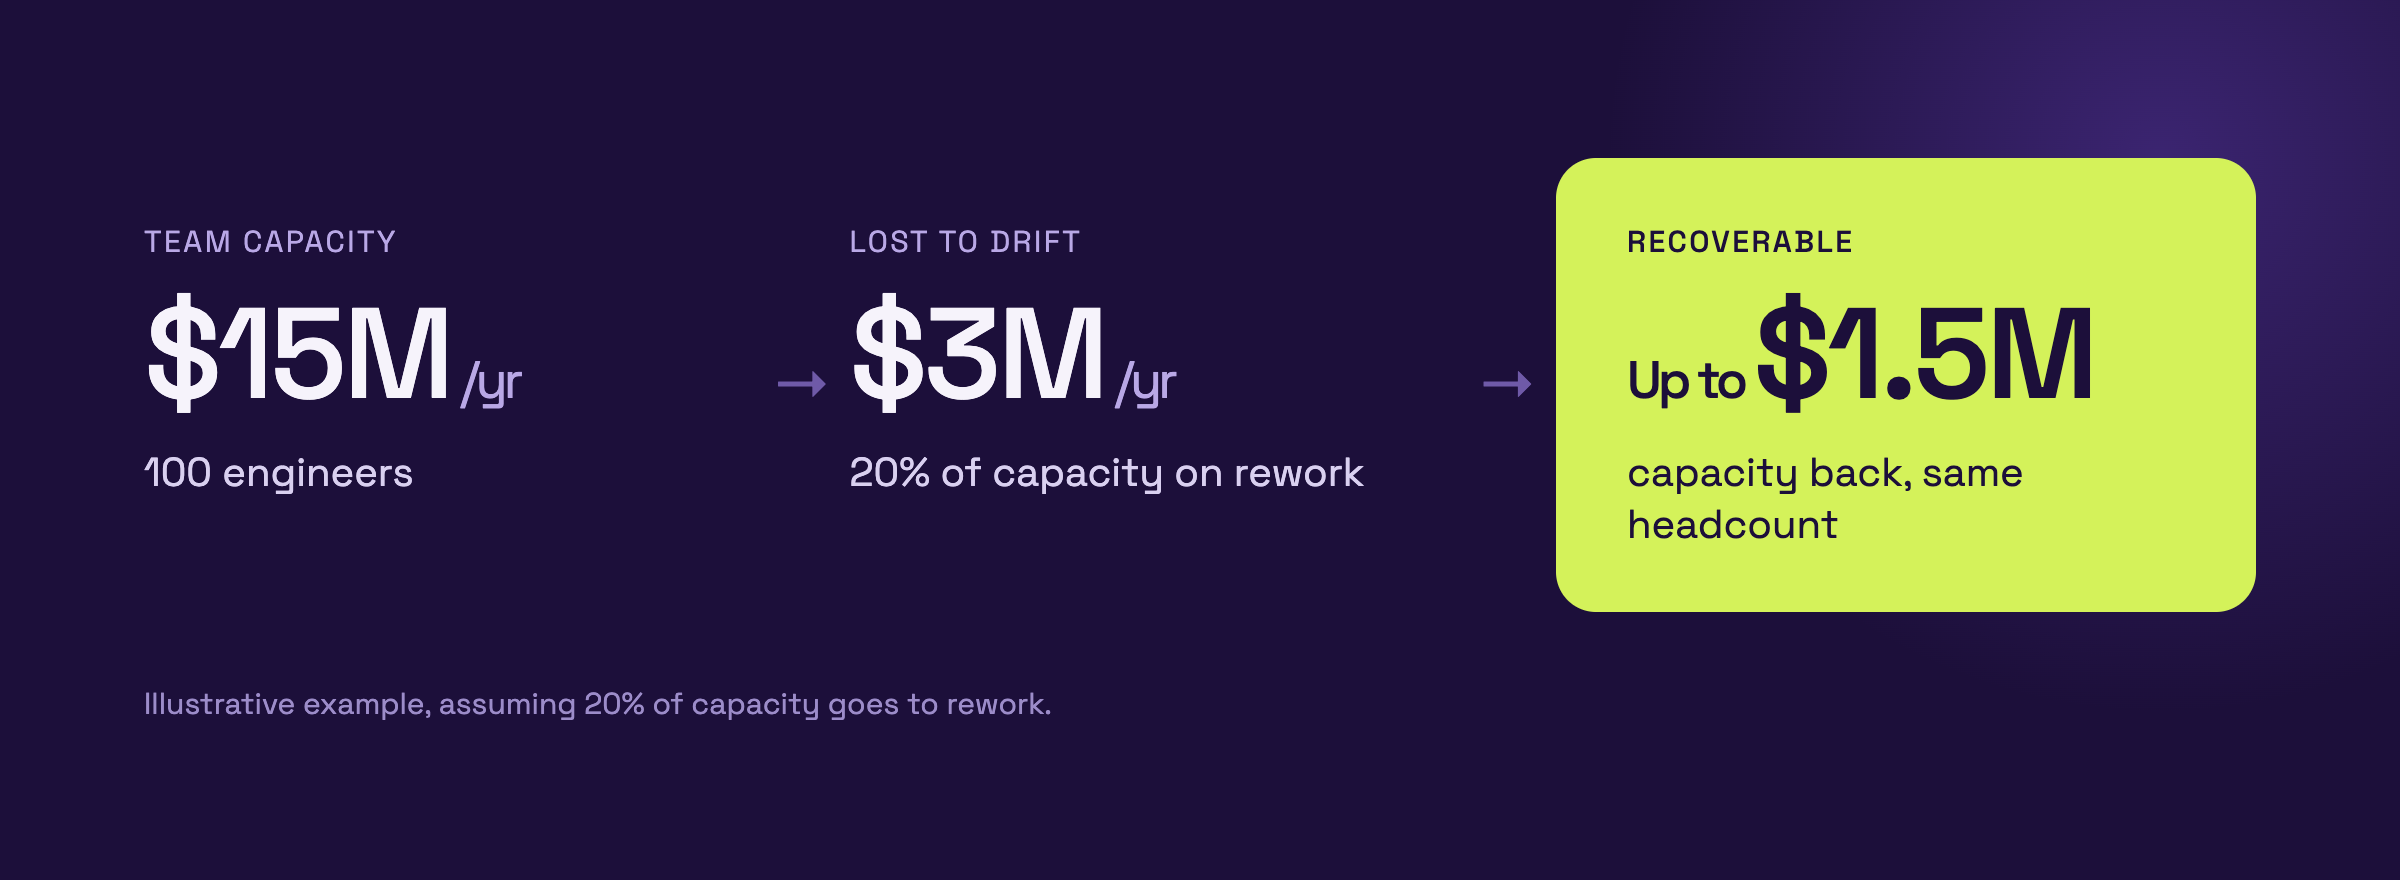
Take an organization with 100 engineers at a fully loaded cost of $150,000 each. That is $15 million a year in engineering capacity.
Now assume one day in five goes to redoing work: code rewritten after review, features reworked after failing QA, components rebuilt because the right one already existed. That is 20% of capacity, or $3 million a year spent on drift, around $30,000 per engineer.
If half of that rework were eliminated, the organization would recover up to $1.5 million a year in capacity, without changing headcount. Even a quarter would be worth $750,000.
Your numbers will be different. That is the point of the calculator.
How the Engineering Drift Calculator Works
The calculator takes about two minutes to fill in, needs no credit card, and shows your result on screen before you talk to anyone.
What You Put In
- Engineering team size, as a band or an exact headcount.
- Blended, fully loaded cost per engineer in USD, EUR, or GBP. If you only know salaries, add around 30% for benefits and overhead.
- Your industry, your role and what your team is working on.
- Three ratings from 1 to 10: how consistently AI-generated code follows your standards, how quickly design-driven features reach production, and how confident you are that engineering time goes to new work rather than rework.
How It Derives Your Estimate
The logic is the same as the example above, in four steps:
- Team cost: Headcount multiplied by fully-loaded cost per engineer.
- Cost of drift: Team cost multiplied by the share of capacity that goes to rework, meaning work redone after it crosses from product to engineering, or after it fails QA.
- Rework recovered: The share of that rework that a governed context layer could eliminate. It is capped at 50%, in line with the up to 2x reduction in frontend rework seen in our deployments.
- Output gained: An output gain, capped at 40%, applied only to the capacity that isn’t already lost to rework. Time recovered from rework can’t also be counted as extra output, so nothing is counted twice.
The result is two numbers: your estimated annual cost of drift, and the value you could potentially recover. You can download both as a PDF report for your finance or leadership team.
One principle holds throughout: headcount stays flat. The calculator never assumes anyone leaves, and it doesn’t claim salary savings. The recoverable value is capacity you can put back into new work.
How to Read Your Result
Your result is a signal for investigation, not proof that all of the estimated lost time can be eliminated. Some rework is healthy: requirements change, and teams learn. The figure tells you how large the problem could be and where to look first.
- Compare it with what you spend on AI tooling. If drift costs more than your AI coding budget, the question shifts from “which tool should we buy?” to “why isn’t our tool following how we build?”
- Test your rework share against real data. Sprint reports, QA failure rates, and reopened tickets will tell you whether your estimate is high or low. If you can’t find that data, that is a finding in itself.
- Read your ratings as a map. Low consistency points to standards that aren’t enforced during coding. Slow design-to-production points to rework between design and engineering. Low confidence in new work points to time lost to correction.
- Run it twice. Once with cautious inputs, once with your best estimate. The range is more useful than either number alone.
- Treat recoverable value as capacity, not savings. It’s time your existing team could put it back into the roadmap, not cut headcount.
Why You Can Trust the Numbers
A calculator is only as credible as its assumptions. We built this one to be conservative and transparent, because a figure you can’t defend in front of your CFO isn’t useful.
- The most important input is yours. The rework share drives the result more than any figure we supply, and we never fill it in for you.
- Our figures are capped. The calculator limits rework elimination to 50% and the output gain to 40%, and it applies them so that nothing is counted twice.
- The mechanism is measurable. Most of what AI coding tools spend goes on reading code, not writing it. A typical workflow reads around 10 tokens for every token it writes, as the agent works out which files, patterns, and services matter. A governed context layer gives the model the exact knowledge it needs before it starts any task, which collapses that ratio.
- The outcomes come from real deployments. In existing DesignVerse enterprise deployments, teams have seen up to 2x less frontend rework. In one case, a 15-year-old air-traffic management system was modernized in about a month, at roughly 60% lower cost than the conventional approach.*
*Figures are based on outcomes observed across existing DesignVerse enterprise deployments. They are directional, not an audited benchmark.
The Main Takeaway: From Number to Decision
The cost of engineering drift stays unmanaged because it never appears as its own line. Once it has a number, it becomes something you can own, track, and reduce, and something you can weigh against your next investment.
That is where the number proves its value. Before you renew AI coding licences, approve a modernization budget, or add headcount to clear a backlog, it is worth asking how much of your current capacity is going to rework, and how much of it you could get back.
This is the conversation to have with our team. Not to walk through the calculator again, but to turn your estimate into a business case you can defend:
- Validate the baseline with your own sprint and QA data, so the rework share is measured, not guessed.
- Agree on what success means before anything starts: lower cost, faster delivery, or fewer rewrites.
- Prove it on one module, by running a proof of concept on real work and measuring the same things afterwards, so the result is something you watched happen, not a slide we presented to you.
The goal is simple: get more value out of the engineering investment you’ve already made, with the team you already have. Calculate our cost of drift to get started.

FAQs
How does the Engineering Drift Calculator estimate the cost of drift?
It multiplies your team cost by the share of capacity that goes to rework, based on your own ratings. The recoverable value combines rework that could be eliminated (capped at 50%) with extra output on the remaining capacity (capped at 40%), without counting anything twice.
Can I eliminate all of the costs it shows?
No. Some rework is a normal part of building software. The result shows how large the problem could be and where to investigate, not a guaranteed saving.
Does the result assume we reduce headcount?
No. Headcount stays flat in every calculation. The recoverable value is capacity your existing team can redirect to new work.
Do I need to talk to sales to see my result?
No. Your result appears on screen as soon as you finish. The PDF report and a demo are optional next steps.